Using the Gantt Chart
TABLE OF CONTENTS
The Gantt Chart feature in Screendragon is designed to enhance your project management experience. It allows users to visualize project timelines, track progress, and manage tasks effectively. Whether coordinating teams or monitoring deadlines, this feature helps keep your projects on track.
Locating the Gantt Chart
- Log in to Screendragon: Log in to your Screendragon account with your credentials.

- Navigate to the Project Dashboard: From the main dashboard, under project name, locate the project you want to work with.

- Select the Project: To open the details and settings, click on the project name.

- Find the Tasks: Click the Tasks icon from the side menu.

- Access the Gantt Chart: Look for the Gantt Chart view in the upper navigation menu.

Open the Gantt Chart
- View Project Timeline: Once the Gantt Chart opens, you'll see a visual representation of your project timeline, with tasks along the horizontal axis and their durations as bars.

- Review Task Details: Click the task name to view detailed information, including start and end dates and assigned resources.


- Adjust Task Dates: If you need to change the schedule, you can click and drag the edges of the bars to adjust start and end dates directly in the chart.

- Set Dependencies: If tasks are related, you can create dependencies by connecting the task bars. This helps visualize the project's flow and manage timelines effectively.

- Setting a Baseline: To establish benchmark performance levels, click Settings to designate the selected tasks as baseline tasks. A baseline task is a reference point, providing a standard against which future performance can be measured and compared.


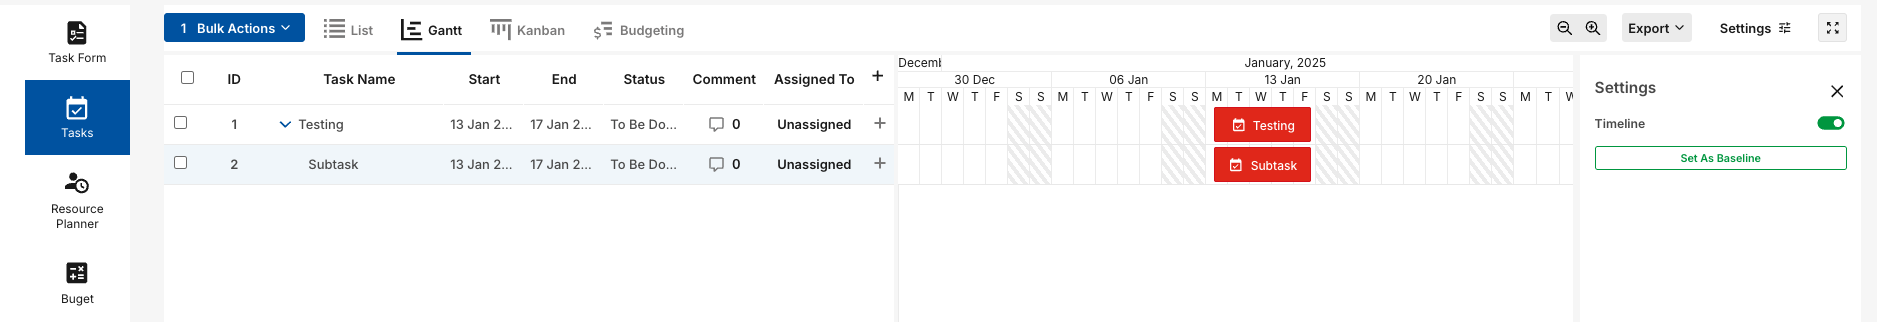
Timeline
When managing tasks in the Gantt Chart, the Gantt View controls how the project schedule is displayed across the horizontal time axis. By adjusting the timeline scale, users can choose the level of detail shown in the Gantt chart — from a high-level project overview to a more detailed view of individual task durations.
Subtasks are supported in the Timeline view; however, they will only appear when the view is enabled if they have been properly tagged.
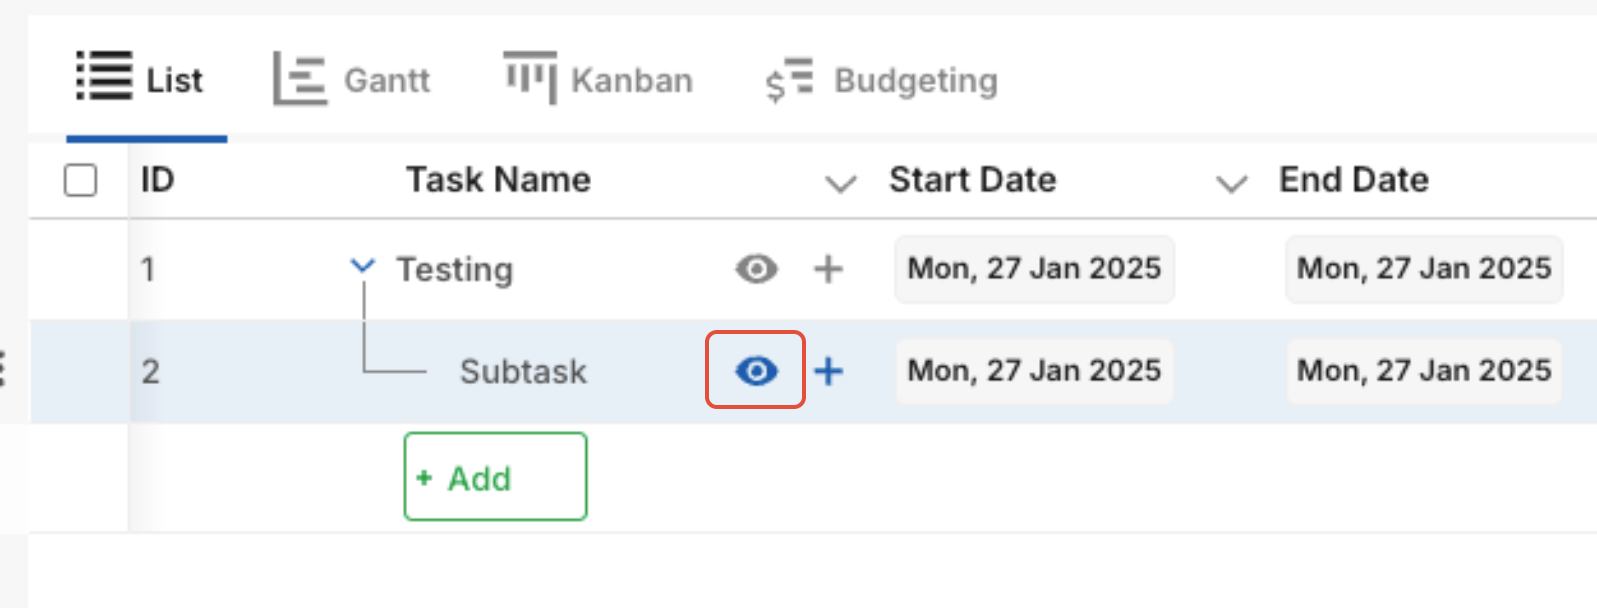
- Navigate to the subtask you want to view in the timeline.
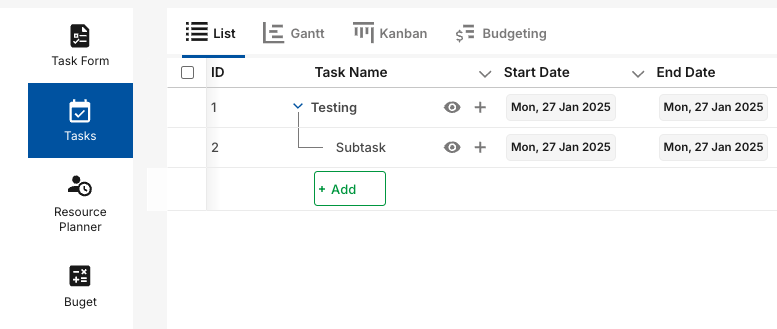
- Click the View icon to open the task details.
- Ensure the Timeline checkbox is enabled.
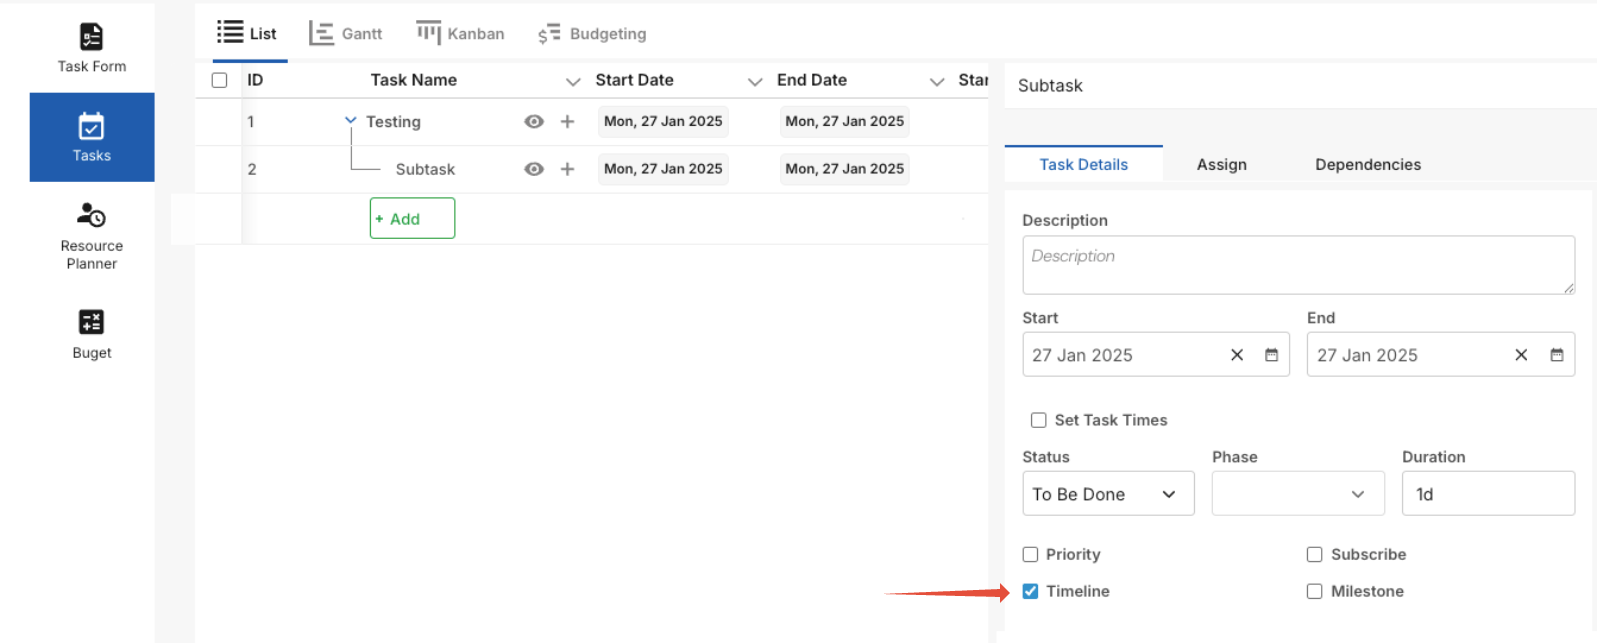
- Next, navigate to the Gantt Chart.
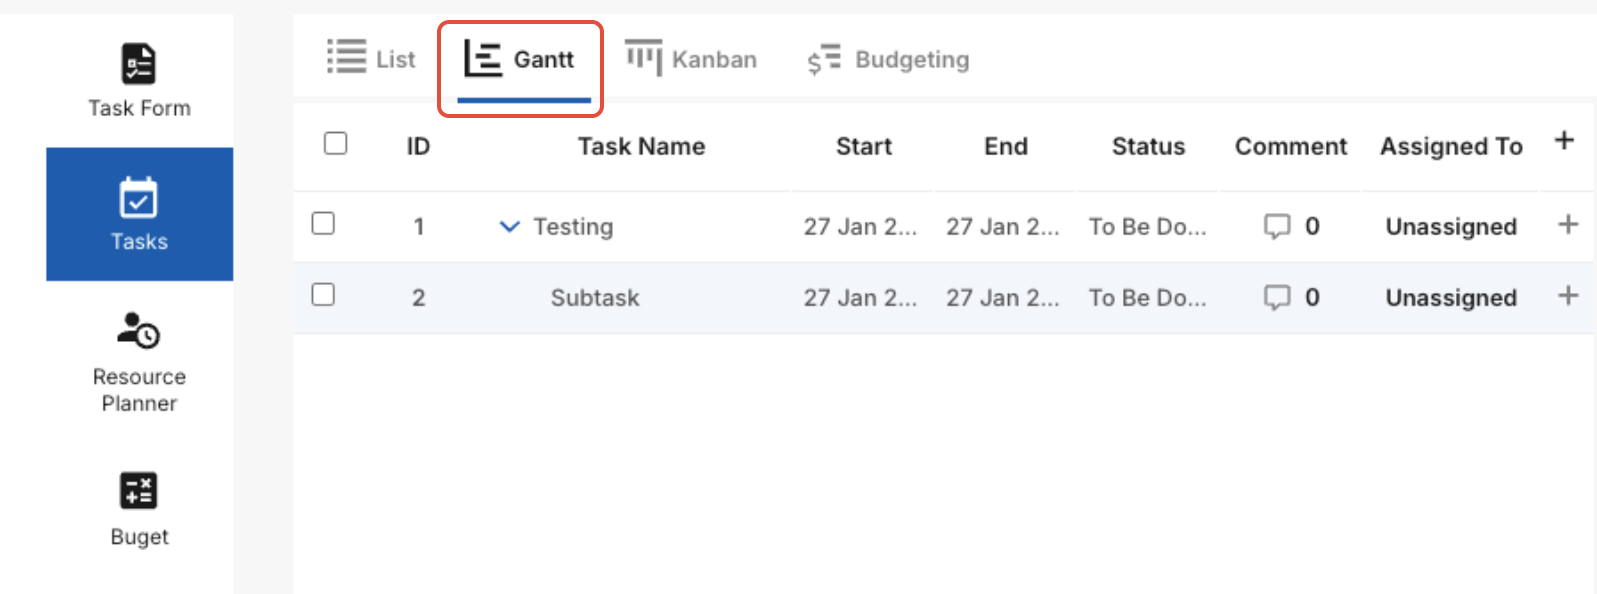
- Then click Settings, make sure the timeline option is toggled on, and ensure the Gantt view displays both parent and child tasks.
For details on other task settings, click here.
Important Notes
- Changing the timeline does not modify task dates or project data.
- The setting only affects the visual scale of the Gantt chart.
- Users can switch timeline views at any point.
- Following these steps, you can efficiently use Screendragon's Gantt Chart feature to manage and visualize your project timelines.
Was this article helpful?
That’s Great!
Thank you for your feedback
Sorry! We couldn't be helpful
Thank you for your feedback
Feedback sent
We appreciate your effort and will try to fix the article