KPI Widget Dashboard Option
TABLE OF CONTENTS
- KPI Widget Dashboard Option
- Types of Reports
- Project Volume Report
- Volume Workflow Report
- Workflow Throughput Efficiency
- Workflows by Status
- Project Budget Overview (Estimated v Resourced v Actual)
Dashboard widgets provide a comprehensive overview of project statuses, facilitating the effective prioritization of daily and weekly activities. This streamlined access to project information empowers management teams to autonomously generate reports on team performance, eliminating the need for manual updates from users.
Additionally, the dashboard's customizable features allow administrators to create new dashboards with tailored widgets using the Dashboard Manager. This adaptability enhances the ability to meet specific organizational needs and optimize project management efficiency.
A dashboard KPI widget allows you to see several KPI charts:
- Project Volume
- Workflow Status
- Workflow Throughput
- Workflow Volume
- Project Budget Overview (Estimated v Resourced v Actual)
- Project Budget Overview Estimated
- Project Budget Overview Resources
- Project Budget Overview Actual
Each KPI chart can be displayed in the following format:

Types of Reports
- Area
- Bar
- Bar (stacked)
- Donut
- Line
- Pie
- Treemap
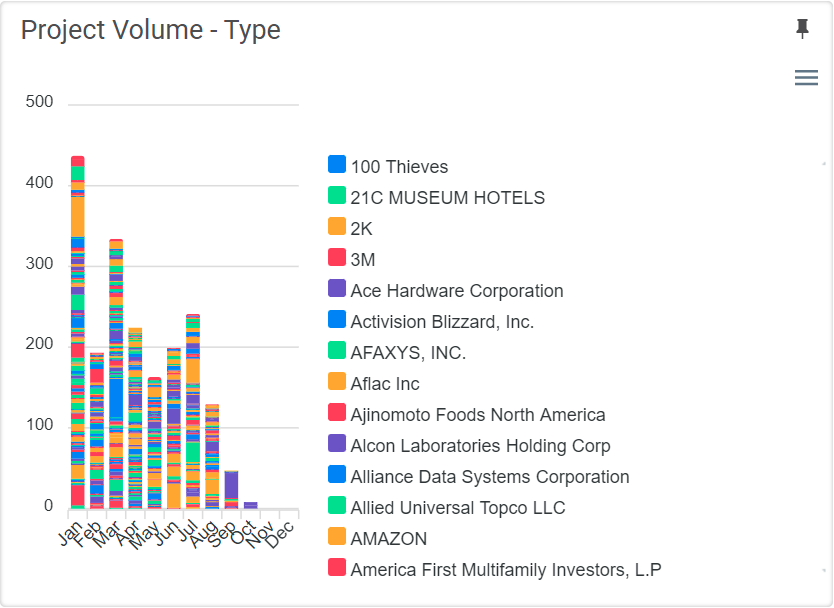
Project Volume Report
This report shows the number of projects you work on by month, client, business unit, market, etc.
Volume Workflow Report
This report shows the volume of workflows (for example, briefs) by type, month, etc.
Workflow Throughput Efficiency
This report provides a comprehensive view of the number of projects in progress, categorized by month, client, business unit (BU), market, and other relevant metrics.
For instance, when a requester submits a design workflow form, the time required for completion may vary significantly among users.
Different stakeholders may define completion differently. Some may consider the initiation of a project to be its completion, while others may view it as the point at which the workflow receives full approval.
This nuanced understanding of completion timelines is essential for accurate project tracking and resource allocation.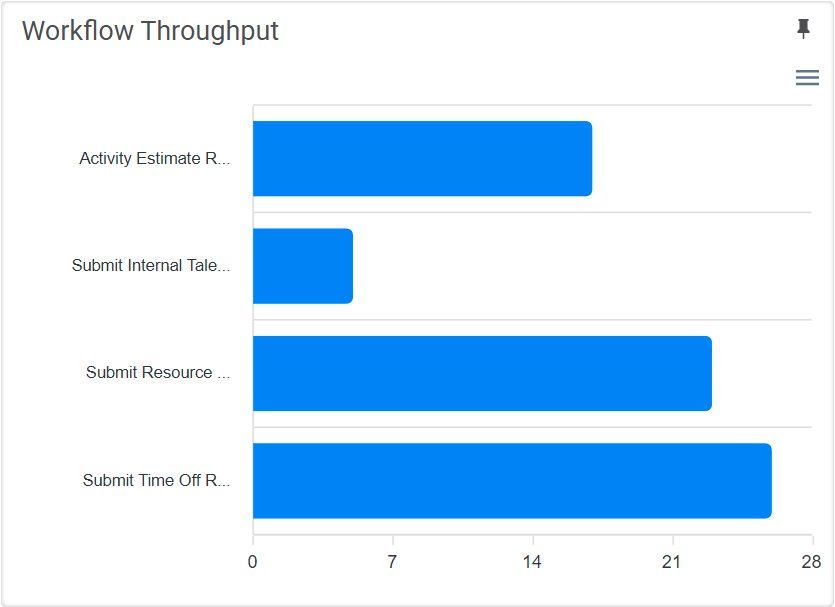
Workflows by Status
This report displays the percentage of workflows categorized by their respective statuses.
It provides insight into the current stages of workflows, such as:
- Awaiting Technical Specifications
- Awaiting Project Management Review
This visibility enables the effective tracking of workflow progress and the identification of potential bottlenecks.
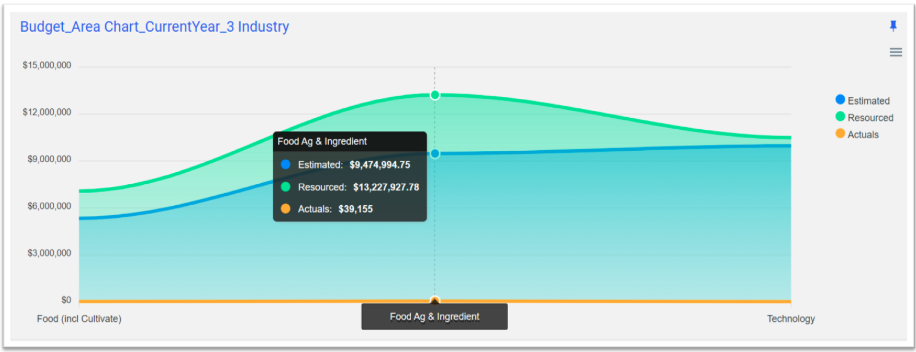
Project Budget Overview (Estimated v Resourced v Actual)
This report comprehensively compares project financials, including original cost estimates, resourced costs, and actual expenditures.
Users can generate reports for individual metric types, allowing for focused analysis of estimated, resourced, or actual costs. This flexibility enables a more comprehensive understanding of financial performance and budget adherence on a project-by-project basis.
Was this article helpful?
That’s Great!
Thank you for your feedback
Sorry! We couldn't be helpful
Thank you for your feedback
Feedback sent
We appreciate your effort and will try to fix the article